Analyzing Tweets and Sentiment with R
Analyzing Twitter Sentiment
A while back I was talking to a friend about their experience using Twitter and the twitter API. I had always assumed that it must have entailed a lot of web scraping difficult parsing and headaches.
However, I was pleasently surprised to learn that this in fact never was the case. Its so easy that there are a plethora of ways to get started and a number of R packages that do most of the heavy lifting for you.
One of the most difficult parts of the entire experience turned out being registering my username with twitter and waiting for them to grant me api access.
A few helpful blog posts were available to provide some pointers for setting up my api key registration here and an incredibly user friendly API that helped me to get started parsing and downloading tweets. here
For a list of positive and negative sentiment words, I used the list created by Liu Bing at the university of Illinois at Chicago(UIC), here
Finished product You can find the finished project as an R shiny app here.
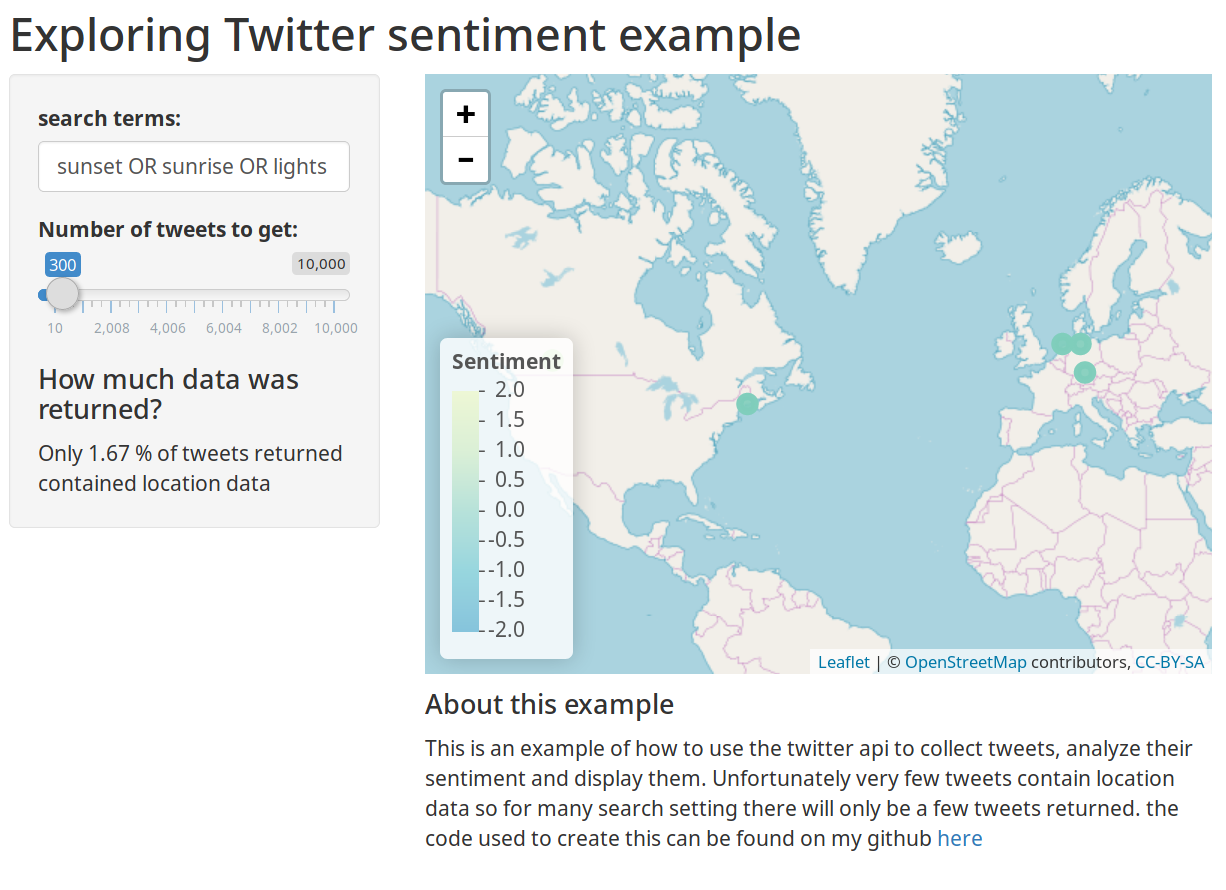
There were a few things that I was surprised by while making this app:
- getting color scales to work on plotly is incredibly difficult and getting a flipped colorscale that is correct can be a non trivial endeavor.
- Most tweets do not have location data, so mapping out twitter trends is much more difficult than people on line make it seem
- R has a very mature way of dealing with tweets and processing twitter data with multiple walkthroughs and packages.